
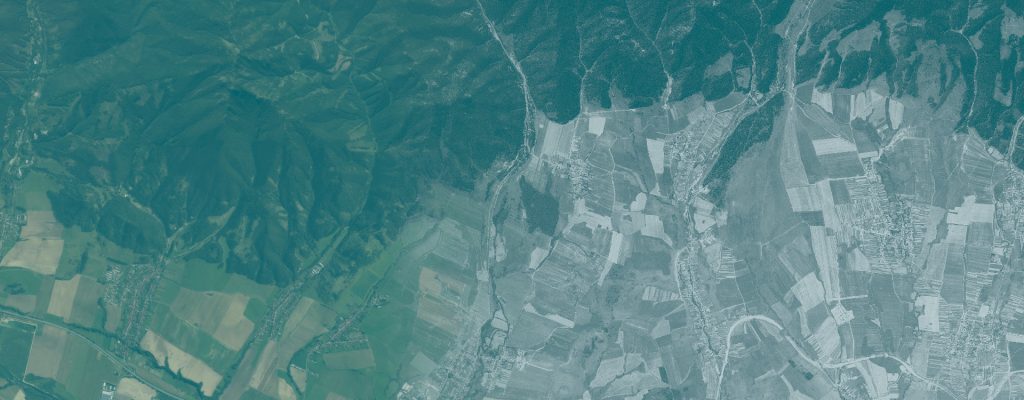
Historical Land-Cover Mapping in Tatra National Park
Reconstructing land cover in Hrebienok in 1975 through image segmentation and expert interpretation.
Use case
RETROCOVER
Author
Šimon Saloň
Presentation
Roman Kadlečík, Ladislav Šumichrast
Institution
Technical University in Zvolen, Slovakia
Research areas
Historical land-cover mapping; remote sensing; geoinformatics; landscape ecology
Study area
Hrebienok, Tatra National Park, Slovakia · 2,500 ha demonstration area
Reference period
1975
Research question
How can a historical black-and-white satellite image be turned into a documented land-cover map that can be checked, revised and reused?
Overview
This use case demonstrates the Landscape application on KH-9 Hexagon imagery of Hrebienok in Tatra National Park from 1975. It combines automated image segmentation with expert interpretation to reconstruct the physical land cover of a 2,500 ha area.
The application proposes candidate polygons; the operator assigns classes, checks their meaning and edits their boundaries. A class catalogue, review status, statistics and result lineage help users document both the map and the decisions behind it. Land use is added only where knowledge of the site supports the interpretation.
Inputs and workflow
What you need
- An orthorectified panchromatic image. The demonstrated KH-9 product has a 0.5 m pixel grid.
- A classification catalogue appropriate to the study area and mapping purpose.
- Expert interpretation and local knowledge for reviewing classes and resolving ambiguous features.
Main steps
- Create or open a project and select the historical raster.
- Prepare working rasters at resolutions suited to the mapping scale.
- Segment the image into candidate polygons.
- Assign classes, review the interpretation, and merge or split polygons where necessary.
- Inspect statistics and result lineage; export maps and derive simpler classifications where useful.
What you get
- A historical land-cover layer with a documented legend and review status.
- Area statistics by class and records linking results to their source data and processing settings.
- Map outputs for presentation or print, and derived layers such as forest/non-forest under an explicit reclassification rule.
Demonstrated example
The demonstration provides a 1975 mapping baseline. It also shows how expert review can distinguish features that segmentation alone cannot label reliably, such as forest and dwarf pine, or a stream and a path.
Interpretation and limits
The comparison shown in the presentation is between editing versions of the same historical map. It records progress in classification. Measuring landscape change requires comparable maps from different acquisition periods. A 0.5 m output grid does not establish positional accuracy.
Video demonstration
A recorded walkthrough of the five mapping steps, expert review, statistics and map outputs.
Materials
The supporting materials will be linked here as they become available.
Workflow package
Application, English and Slovak notebooks, and environment definitions.
Download workflow package (ZIP)User guide
Installation, project setup, mapping workflow, notebook use and troubleshooting.
Download user guide (PDF)How to reuse this use case
Use this workflow for historical mapping, teaching image interpretation, or preparing a baseline for later change analysis. Define the class catalogue and mapping scale for the new area, retain the review records, and check the documentation for the application version being used.
When reporting results, identify the input datasets and acquisition dates, the workflow version, processing settings and evaluation scope. Keep the documentation with the files you reuse and follow the license supplied with each resource.