
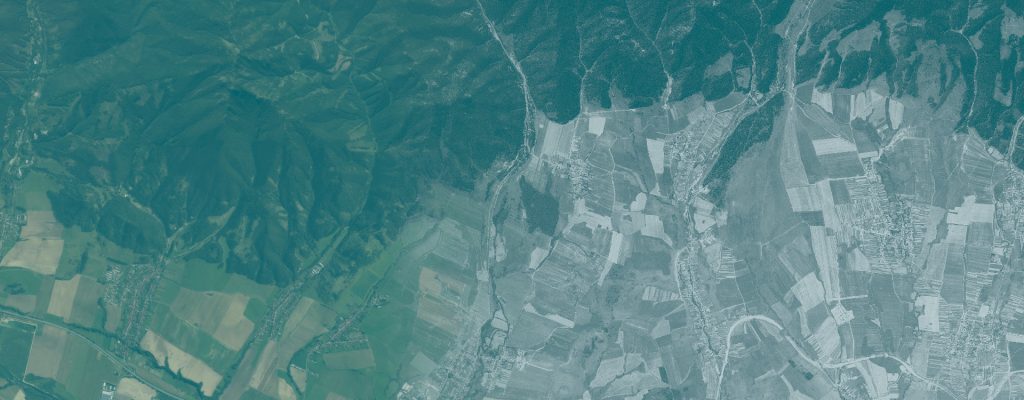
Forest Fragmentation and Core-Forest Continuity
Analysis of forest fragmentation and forest edges from historical satellite imagery.
Use case
RETROFRAG
Author
Ladislav Šumichrast
Institution
Technical University in Zvolen, Slovakia
Research areas
Landscape ecology; forest ecology; habitat fragmentation; remote sensing; geoinformatics
Study area
Poloniny–Bieszczady · Ruské, Brzegi Górne and Havešová
Reference period
1975; Ruské comparison with 2017
Research question
How fragmented is a forest, how much of it lies away from open-land edges, and how do these properties differ between dates or areas?
Overview
Forest cover alone does not describe the spatial conditions of a forest habitat. RETROFRAG measures the arrangement of forest patches, their edges and the amount of core forest using one or two completed forest/non-forest maps.
The tool supports three analysis designs: a single map, the same area at two dates, or two areas at the same date. An analysis notebook and a form-based interface use the same calculations. The supplied examples use historical maps derived from 1975 KH-9 imagery and a 2017 forest map of Ruské.
Inputs and workflow
What you need
- One or two binary forest/non-forest GeoTIFFs in a projected coordinate system in metres, with explicit NoData values.
- For two dates, maps covering the same area on exactly the same grid.
- Explicit choices of analysis grain, minimum patch/opening size and edge depth.
Main steps
- Open the interface notebook or configure the analysis notebook.
- Select the analysis mode and the forest map or maps.
- Set the grain, minimum size rules and depth of edge influence; run the analysis.
- Inspect patch indicators, morphology, core forest and forest area density.
- Compare dates or areas where selected; export maps, tables, figures and the run settings.
What you get
- Patch, fragmentation and edge indicators, including core-forest shares.
- Maps distinguishing core forest, outer edges, perforation edges and islets, plus forest area density.
- For two dates, core-forest continuity maps and tables; sensitivity checks for selected grain and size settings.
Demonstrated example
In the documented Ruské comparison, forest cover rose from approximately 64% in 1975 to 87% in 2017 within the shared 2,371 ha analysis area. Core forest, defined as forest more than 50 m from open land, rose from approximately 50% to 76% of forest area.
The denominators differ: forest cover refers to the analysis area, while core-forest share refers to forest area.
Interpretation and limits
Results inherit the quality and definition of the input forest maps and depend on grain, minimum size rules and edge depth. The tool quantifies the structure of supplied maps; it does not classify the source imagery or produce a complete forest loss/gain analysis. More forest and more core forest can coincide with a loss of valuable open habitats.
Video demonstration
A recorded explanation of the analysis modes, settings, indicators and examples from Ruské and Brzegi Górne.
Materials
Workflow package
The analysis notebook and form-based interface, with the environment definition. Keep both notebooks together.
Download workflow package including data (ZIP)User guide
Input requirements, analysis settings, indicator definitions, interpretation and reporting guidance.
Download user guide (PDF)Presentation
Analysis modes, settings, indicators and worked examples from the Poloniny–Bieszczady region.
Download presentation (PDF)How to reuse this use case
Use RETROFRAG for historical baselines, comparison of protected areas, or repeated assessment of forest structure. The package includes both notebooks, four demo forest maps, a user guide and an environment definition. The documentation describes operation on a local Jupyter installation and on the EOSC EU Node.
When reporting results, identify the input datasets and acquisition dates, the workflow version, processing settings and evaluation scope. Keep the documentation with the files you reuse and follow the licence supplied with each resource.